
Silverlight Spy: A must have tool for any Silverlight Developer
I have been using up Silverlight Spy from many months now, i do a lot of Silverlight development and believe me its a must have tool for every Silverlight developer it gives a feeling that a lot of developer tools have been combined for a Silverlight Developer you have a lot of things in Silverlight Spy, it can be compared to what firebug is to general web development , Silverlight Spy is to a Silverlight Developer. I will show you various different features of Silverlight Spy just as the write-up progresses. Silverlight Spy Features List discussed in the write-up :- 1.Browser Feature 2.Explorer Feature 3.Output Log 4.Properties Window 5.Code View /XAML/C# 6.Statistics 7.Performance Monitor 8.Event Monitor 9.Network Monitor 10.Application Analyzer 11.DLR Shell 12.Cross Domain Access Policy Validator 13.Advanced Settings and Options Now lets start analyzing every single feature of the Silverlight Spy. 1.Browser Feature Silverlight spy comes with inbuilt browser feature you can just give the url to any of Silverlight application and the silverlight spy will open that application for you in the inbuilt browser facility. 2.Explorer Feature Explorer feature is used to navigate to each element in the Silverlight tree , you can go inside each and every element tree to look into what is the xaml used to build up that application. Explorer feature combined with various other inbuilt features will let you do in depth analysis and study of the code.Explorer feature is very useful while you are stuck in small UI issues like your canvas or stack panel or grid are not positioning correctly, silverlight spy will be savior for you at those moments. Like firebug for html pages silverlight spy also have this highlighting feature in-built as soon as you select some element it will get highlighted in the UI in the inbuilt browser. 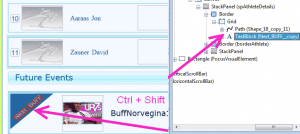 Also there is a cool shortcut to quickly highlight and navigate to a particular element in the application , use Ctrl + Shift to navigate to an element in the silverlight tree. So you can navigate both ways either selecting an element from the UI to the explorer tree or from the explorer tree to the element in the application. 3.Output Log
 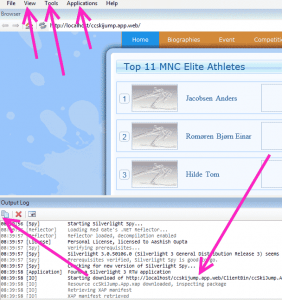 Output window tells you every minute details which are going on while your app is either loading or running sometime you get really frustrating Ag_Parser errors due to some missing images and many other reasons which you cannot know just by looking into the firebug details of your browser. So this output window is really helpful in those scenarios as well. Also the output window lets you know the type of Silverlight application your are using this means the version , prerequisites if any.
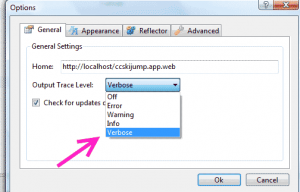
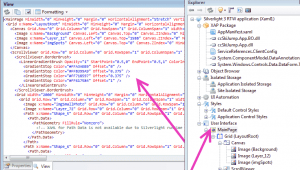
4.Properties Window 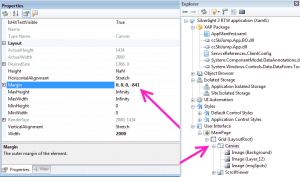 Properties window is a special window where in you can change the properties of the element selected in the explorer window as shown above in the figure. Property window is a great help to find small UI bugs you can adjust margins, padding and height and width and various other properties to reflect changes in the browser so that you know what exactly you need to change in order to get the change in the actual code. Explorer view also contains various other features such as Object Browser, Isolated Storage Browser, UI Automation , Styles and also the User Interface. 5.Code View /XAML/C#
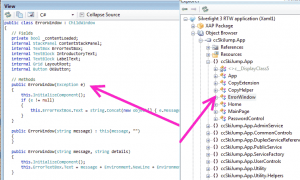
 6.Statistics Statistics window is also a very important and informative part of the Silverlight spy package it calculates for you the number of objects which have been created under a UI Element , you can get the idea of how many elements are getting created under that UI element and whether so many elements are required or not , it gives you information of the Objects including the UIElements, Geometries and Brushes
 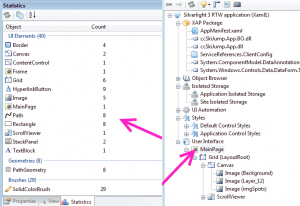 7.Performance Monitor Performance Monitor consists of Memory profiling, process profiling, processor usage, frame rate and isolated storage usage. Performance monitor gives you the real picture of how much memory all your objects and application is taking , how many processes are running and what is the actual load on the processor due to the application, what frame rate is the application running on, and how much isolated storage is being occupied by the Silverlight application
 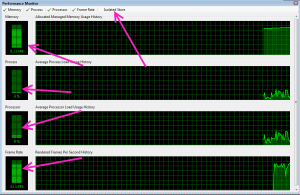 8.Event Monitor Event Monitor is another important tool built inside the Silverlight Spy , basically Event monitor monitors and reports every event which is getting fired ranging from Mouse Enter to GotFocus and all other events , its very helpful when you want to know why your specific event is not firing or what is causing your event to not fire , its really helpful in those situations. Another good things is that you can customize which events you want to fire leaving other unnoticed because many times you would not like to fire the mouseEnter event every time because its really irritating.
 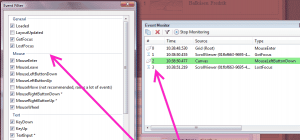 9.Network Monitor Network monitor tracks all the traffic passing through the wires it acts like a mini fiddler from within the Silverlight spy, you can get basic network monitoring features for the application using this Network Monitor tool.
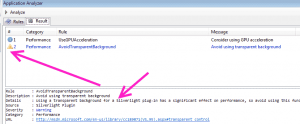
 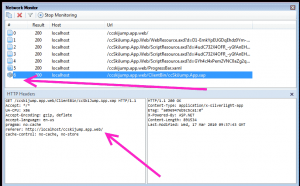 10.Application Analyzer Application Analyzer consists of two tabs one tab contains the rules and another tab contains the results which are shown after the analyze process is complete.Rules consist of Deployment Rules and Performance Rules
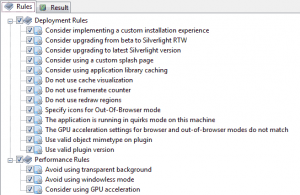
 11.DLR Shell We can also execute dynamic languages such as Ruby and Python in the silverlight applications AppDomain , it has a lot of inbuilt samples also for executing with the DLR Shell, its a very powerful and really interesting feature.
 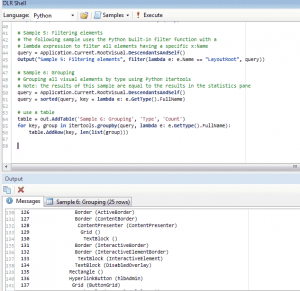 12.Cross Domain Access Policy Validator Cross Domain Access Policy Validator will let you know the status of the cross domain access of the the service files on your server it checks for the correct clientaccesspolicy.xml and crossdomain.xml files if you want to make cross domains call to a server and you want to know whether the server allows cross domains calls or not you can just check the server with the Cross Domain Access Policy Validator tool.
 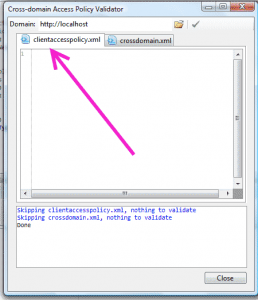 13.Advanced Settings and Options There are various other advanced settings which you can configure according to your development needs, as mentioned above you can add the code reflection support to look up into the code from the xap file using the reflector you just have to give the path of the reflector.exe and silverlight spy will automatically decompile the Silverlight assemblies for you.
 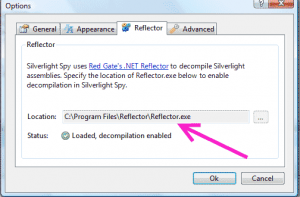 Sometimes if you have a slow internet connection and the xap file size is large then it might take a long time to download for such situations you can increase the xap file download time to any number of seconds otherwise silverlight spy will give a timeout error as soon as the default time is passed.
 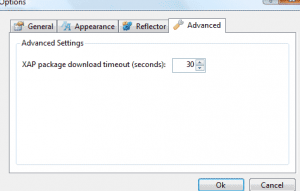 Silverlight spy gives you an option to turn on the inbuilt ruler to have accurate measurements in the application UI you can look yourself the relative margins and the height and widths of the UI elements.
  You can download the latest bits of the Silverlight spy which works for the latest Silverlight 4 build from http://firstfloorsoftware.com/downloads/SilverlightSpy3/SilverlightSpy.3.0.0.11.msi Happy Programming !!!!!!!!!!!!!!!!!!!!!!!!!!!!!!!!!!!!!!!!!!!!!!!!!! Update : 22 Sept 2010 If you are using Silverlight Spy with your MEF application in Silverlight then you will get a nice little error as soon as you try to open up your application in Silverlight Spy.To rectify this you have to go to Tools –> Options –> Advanced->Enable DLR and uncheck the enable DLR option.